
Datasets in 3 minutes
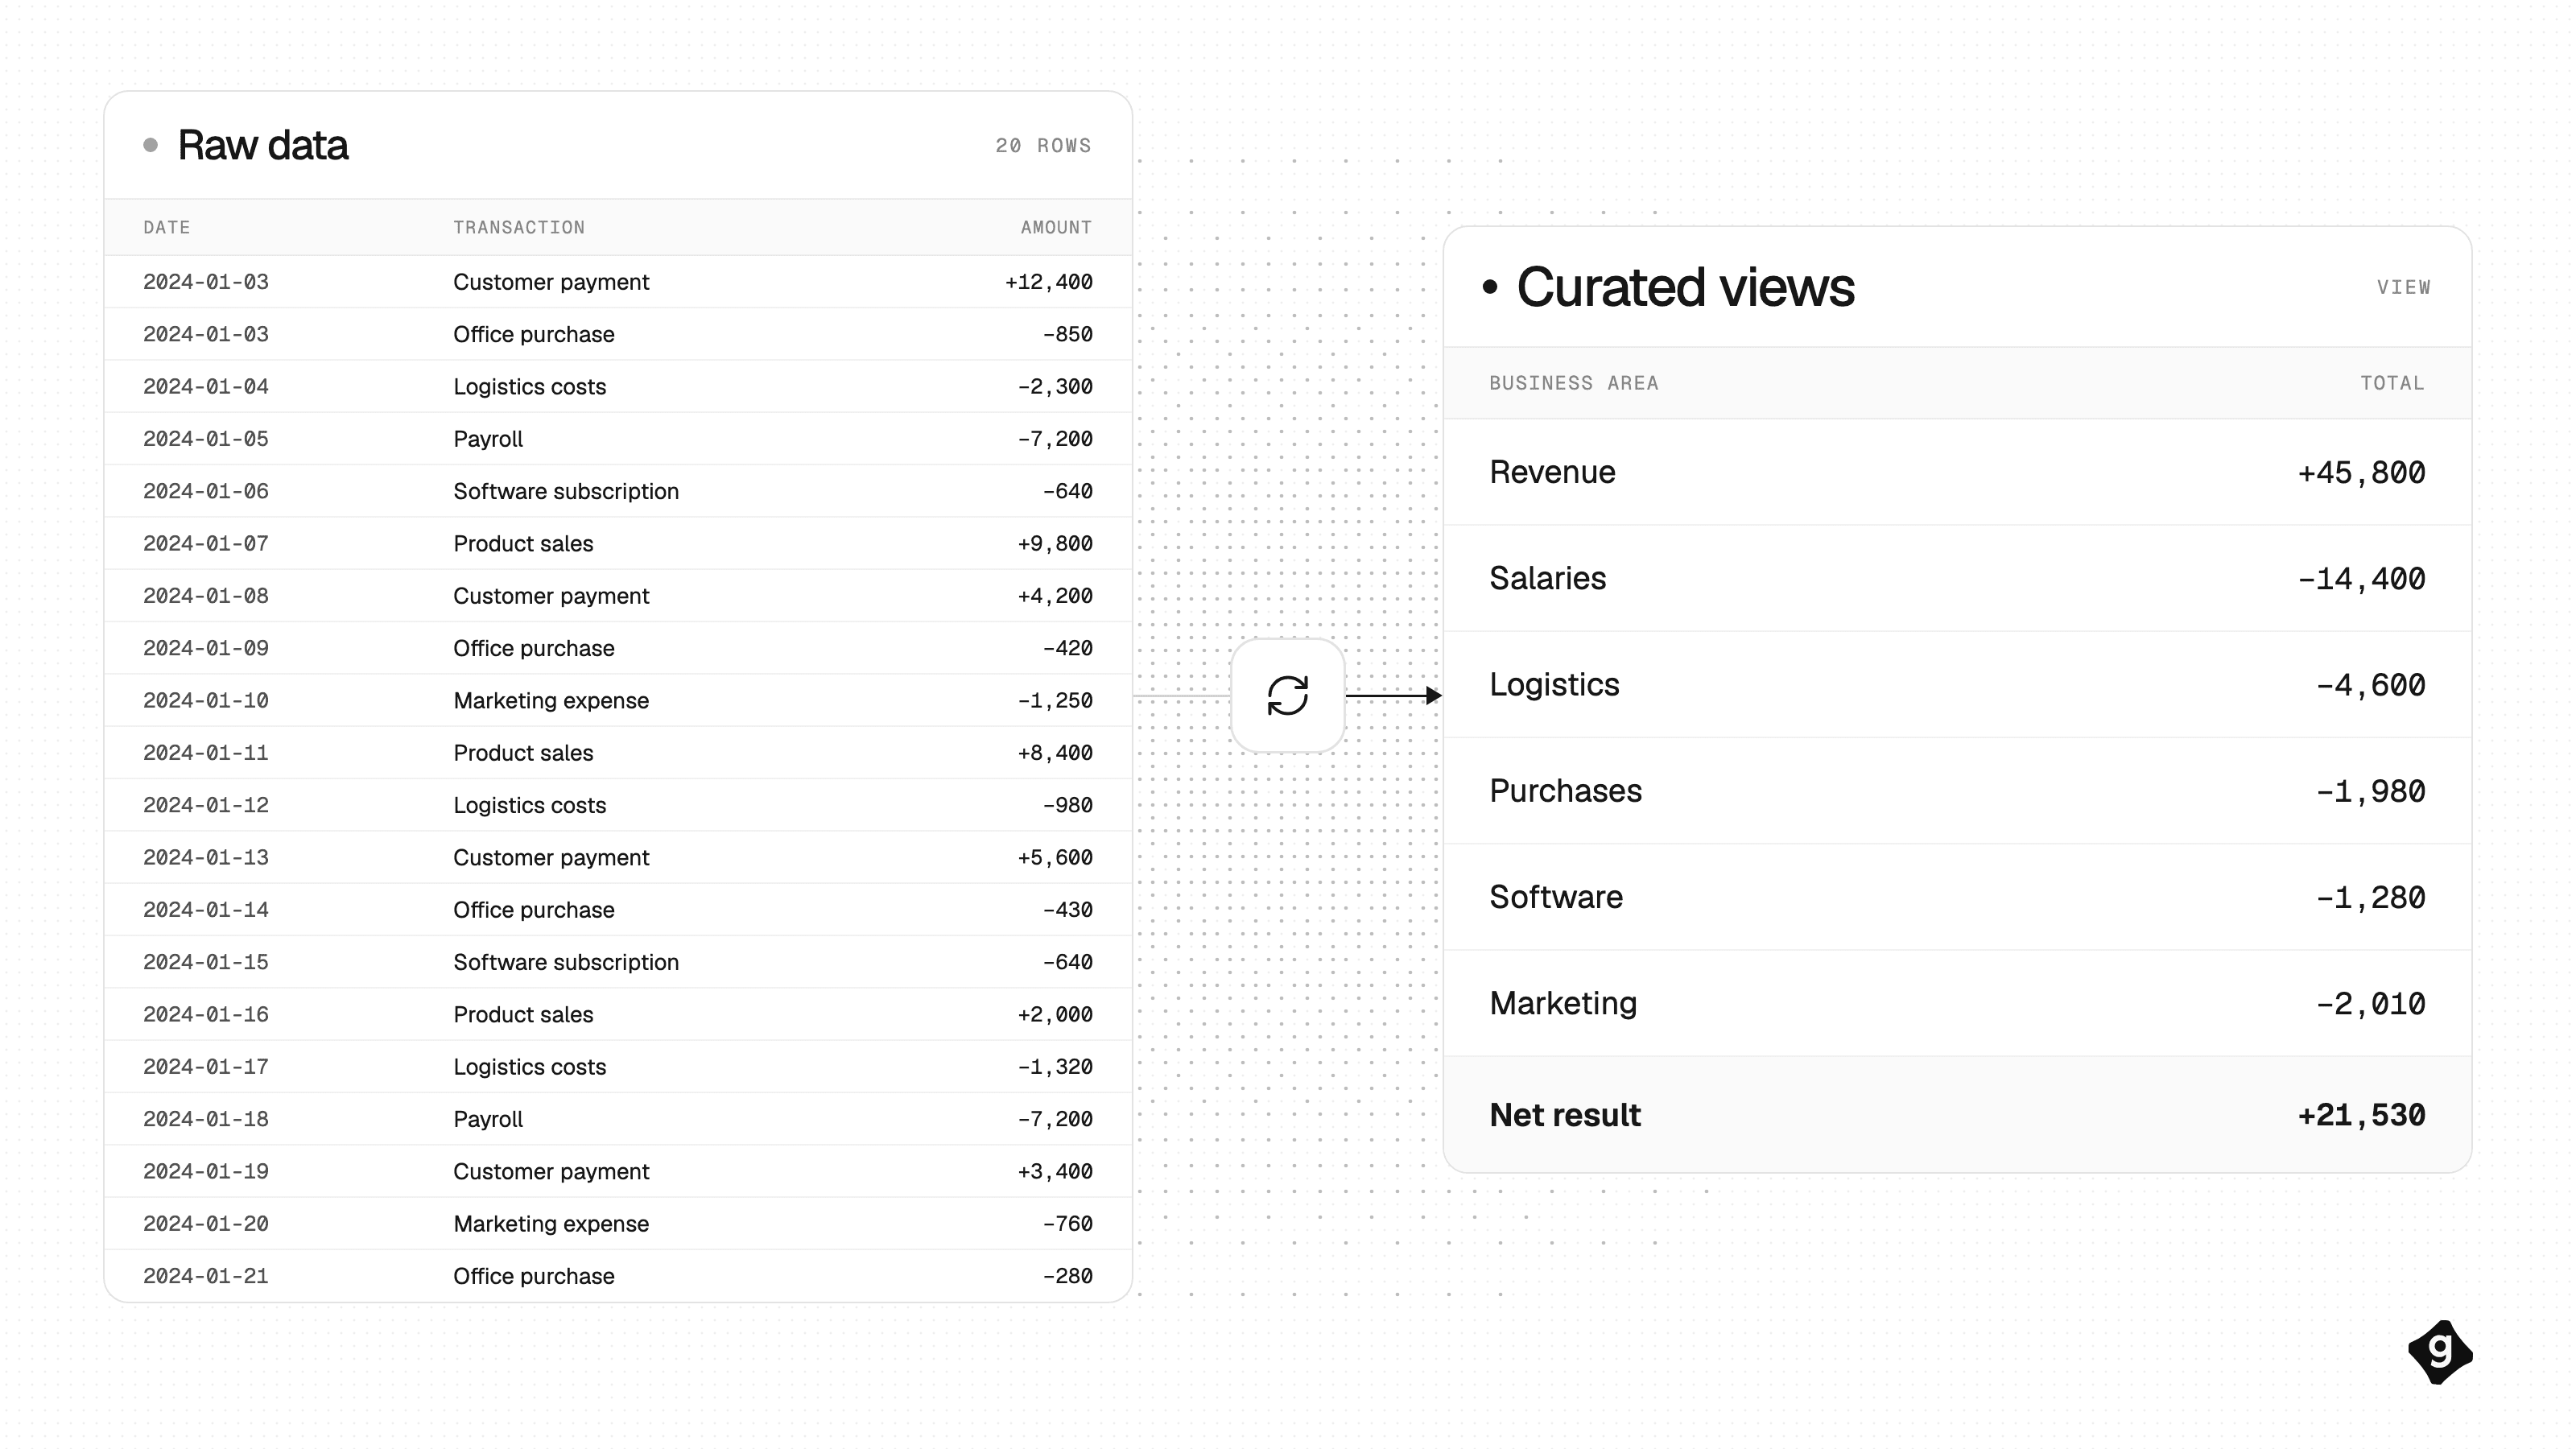
Have you ever found yourself checking the same data or rebuilding the same analysis over and over? Datasets help you turn raw source data into reusable business tables, so Claude can answer recurring questions without reconstructing the logic every time.
What is a dataset?
- A dataset is a reusable business table with consistent transformation logic, context and definitions. It converts raw data from systems such as Stripe, Shopify or your accounting platform into a structure designed around a business question.
For example, instead of repeatedly joining transactions and customer records, you can create one customer dataset containing customer names, countries, regions and revenue. Claude can then reuse that dataset across future analyses, reports and dashboards.
How to create a dataset
You do not need to write SQL or manually map every field. Describe the result you want, and Claude can explore the data available through Gatlas, propose the transformation and create the dataset.
You need Claude connected to Gatlas through a Read/write agent key. A Read-only key can explore data but cannot create a dataset. See Connect your agent.
Explore the available data
Start by asking what information is available in your connected source. This allows Claude to inspect the relevant tables and fields before deciding how the dataset should be structured.
Prompt What customer-related data is available in my raw data from Stripe?
Claude will explain what customer, transaction and revenue information is available, including any limitations that could affect the analysis.
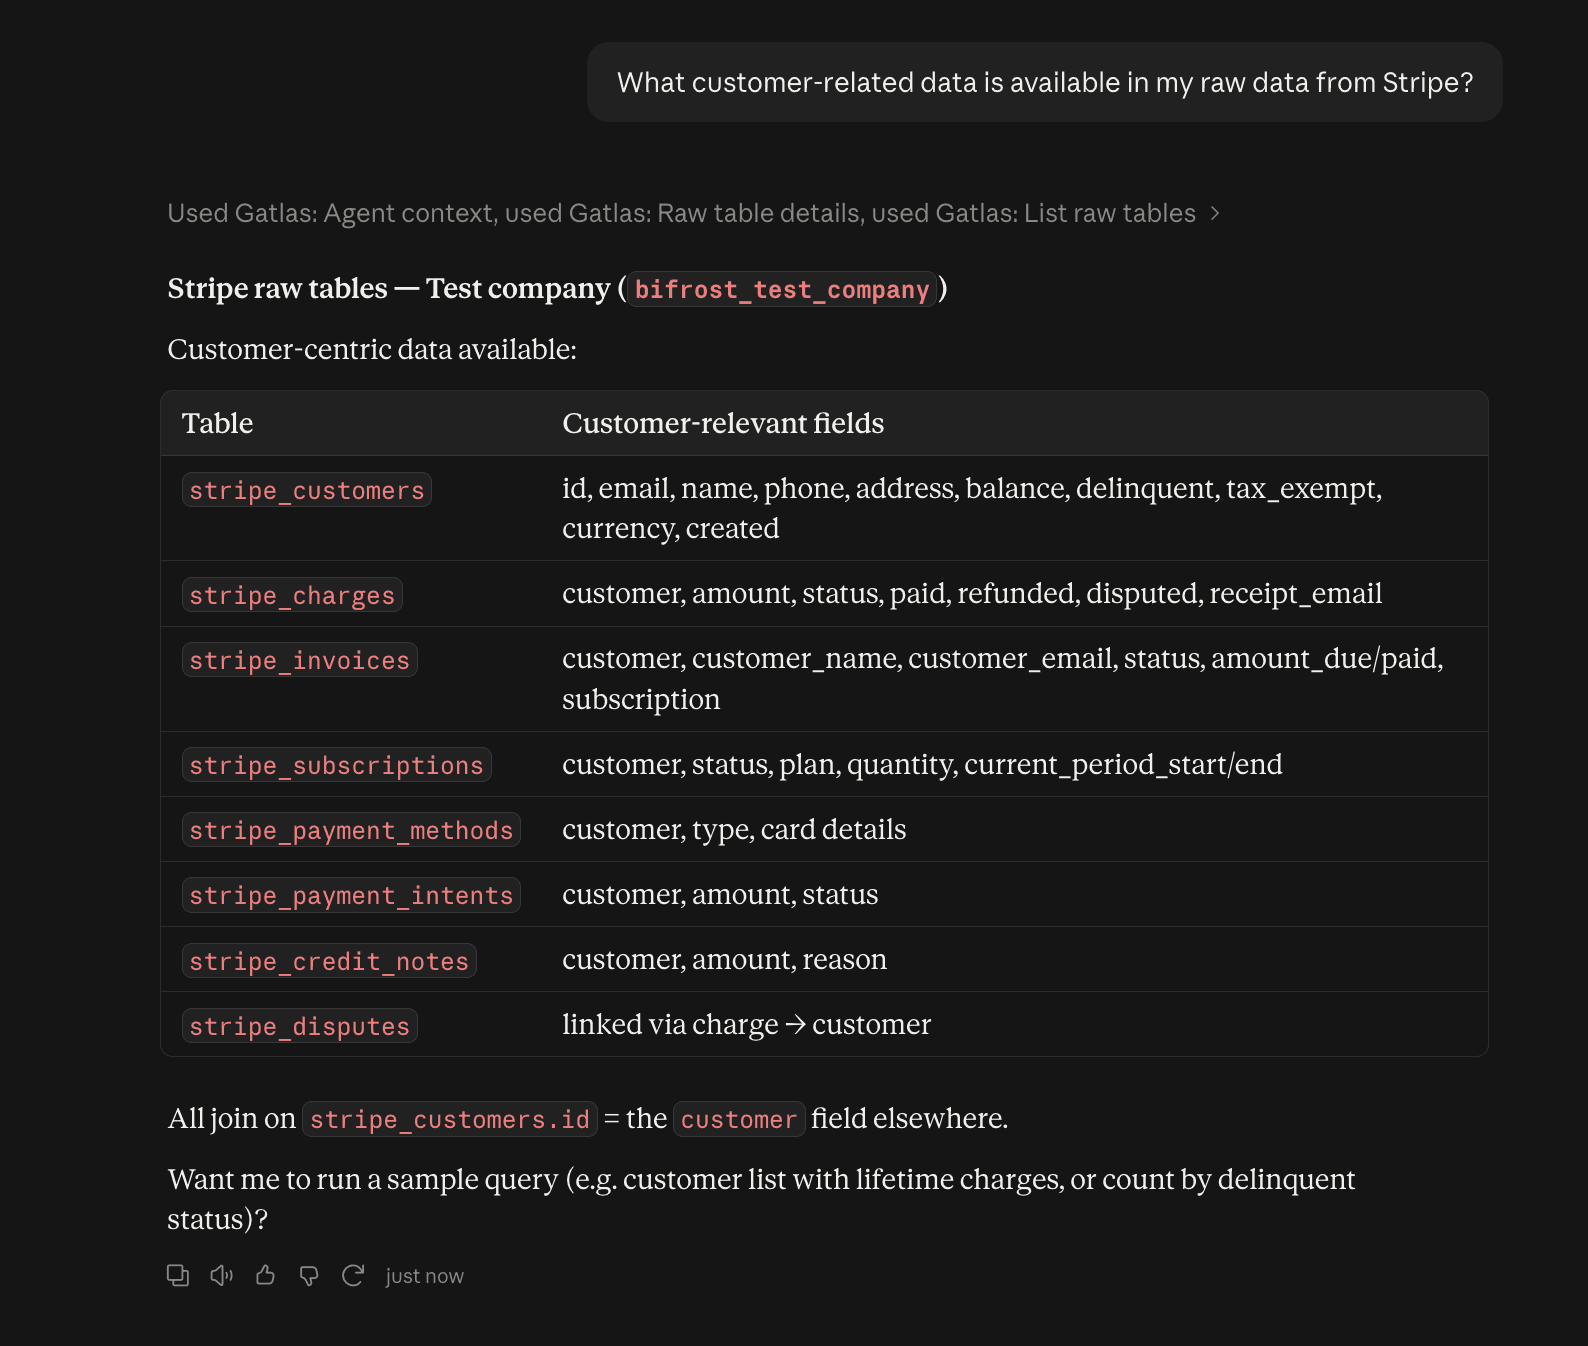
Available Stripe customer data. Request the transformation
Describe the business result you need using familiar business language. Include the dimensions and metrics you expect, but let Gatlas map them to the actual source fields.
Prompt Create a customer dataset grouped by country and geographic region. Include customer name, revenue, country and region.
Before creating the dataset, review the proposed fields and definitions. Check how customers are identified, how revenue is calculated and how countries are assigned to regions. This ensures the dataset reflects the intended business meaning.
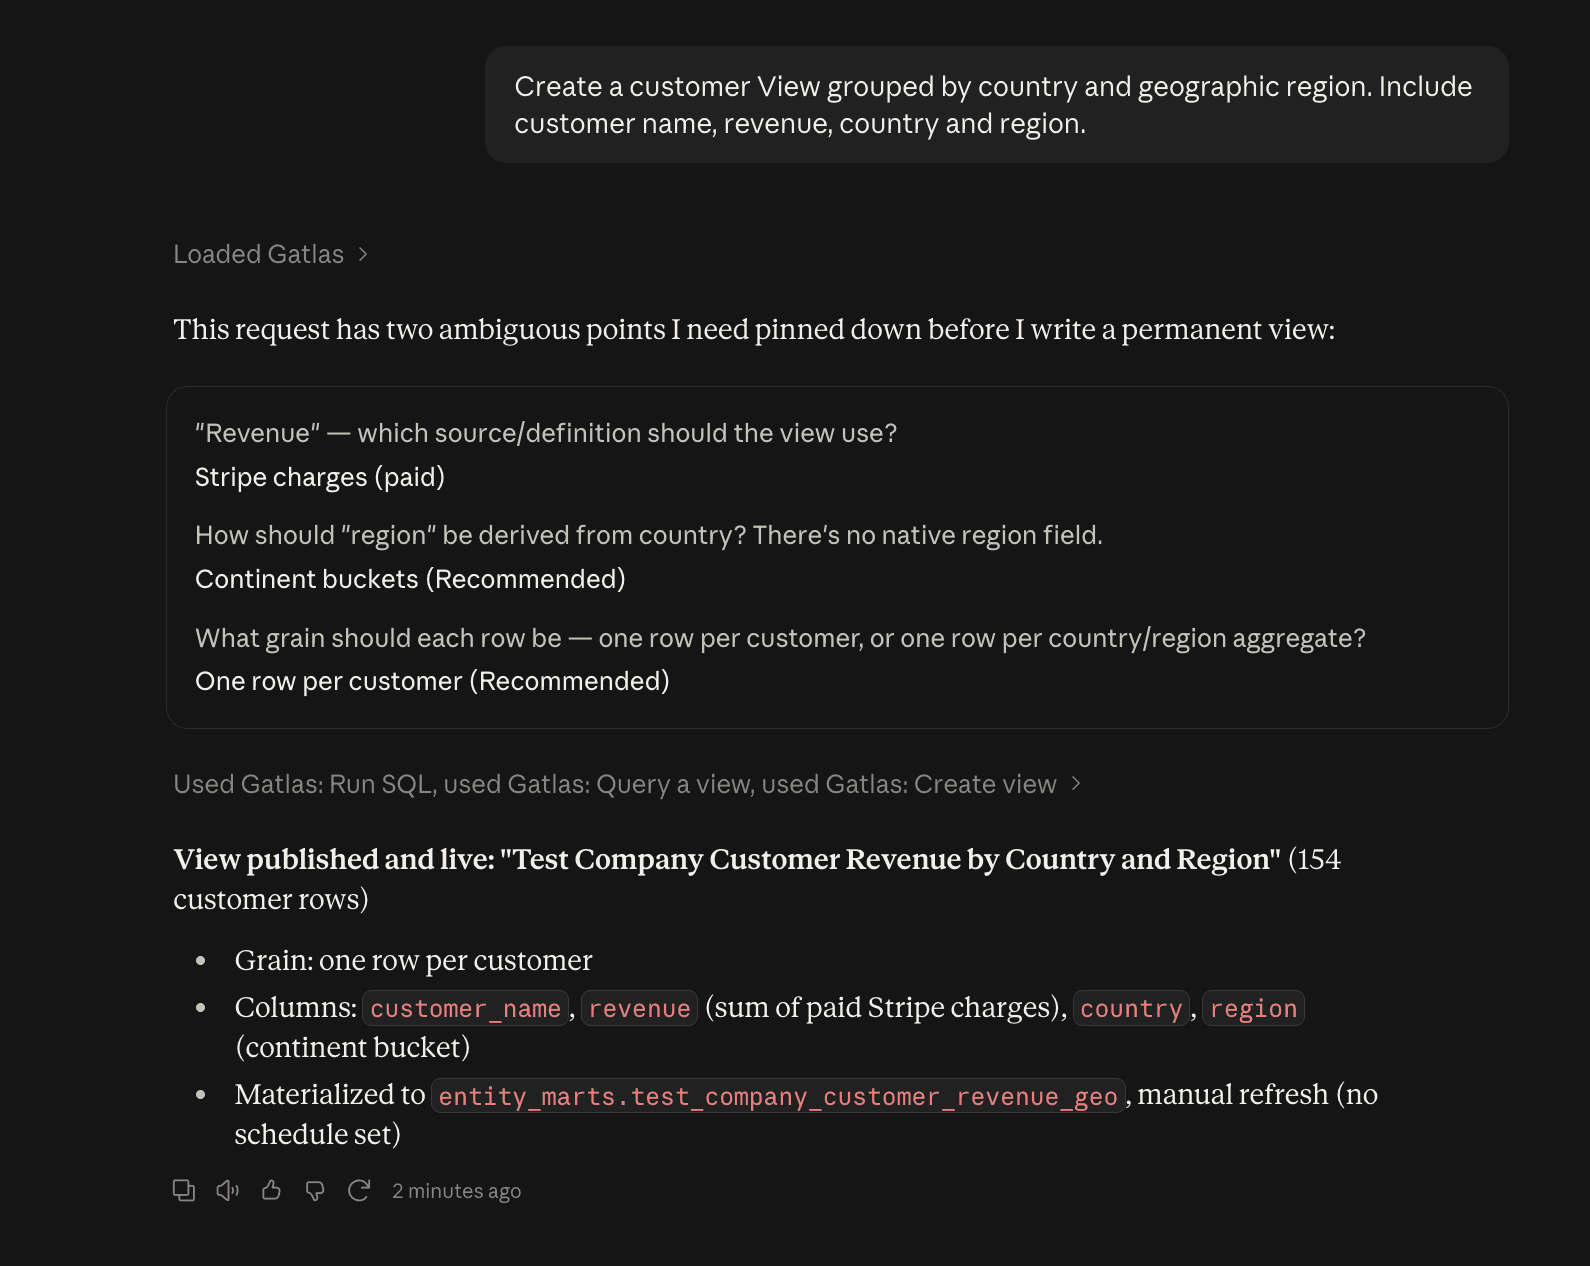
Proposed customer dataset. Use the result
Once created, the dataset is documented and Claude can query it directly. You can use it for one-off questions, recurring analysis, reports or dashboards without rebuilding the transformation.
Try it Show revenue by country, including the number of customers and geographic region, using the new customer dataset.
Because the business logic already exists in the dataset, Claude can focus on answering the question rather than rediscovering the underlying data structure.
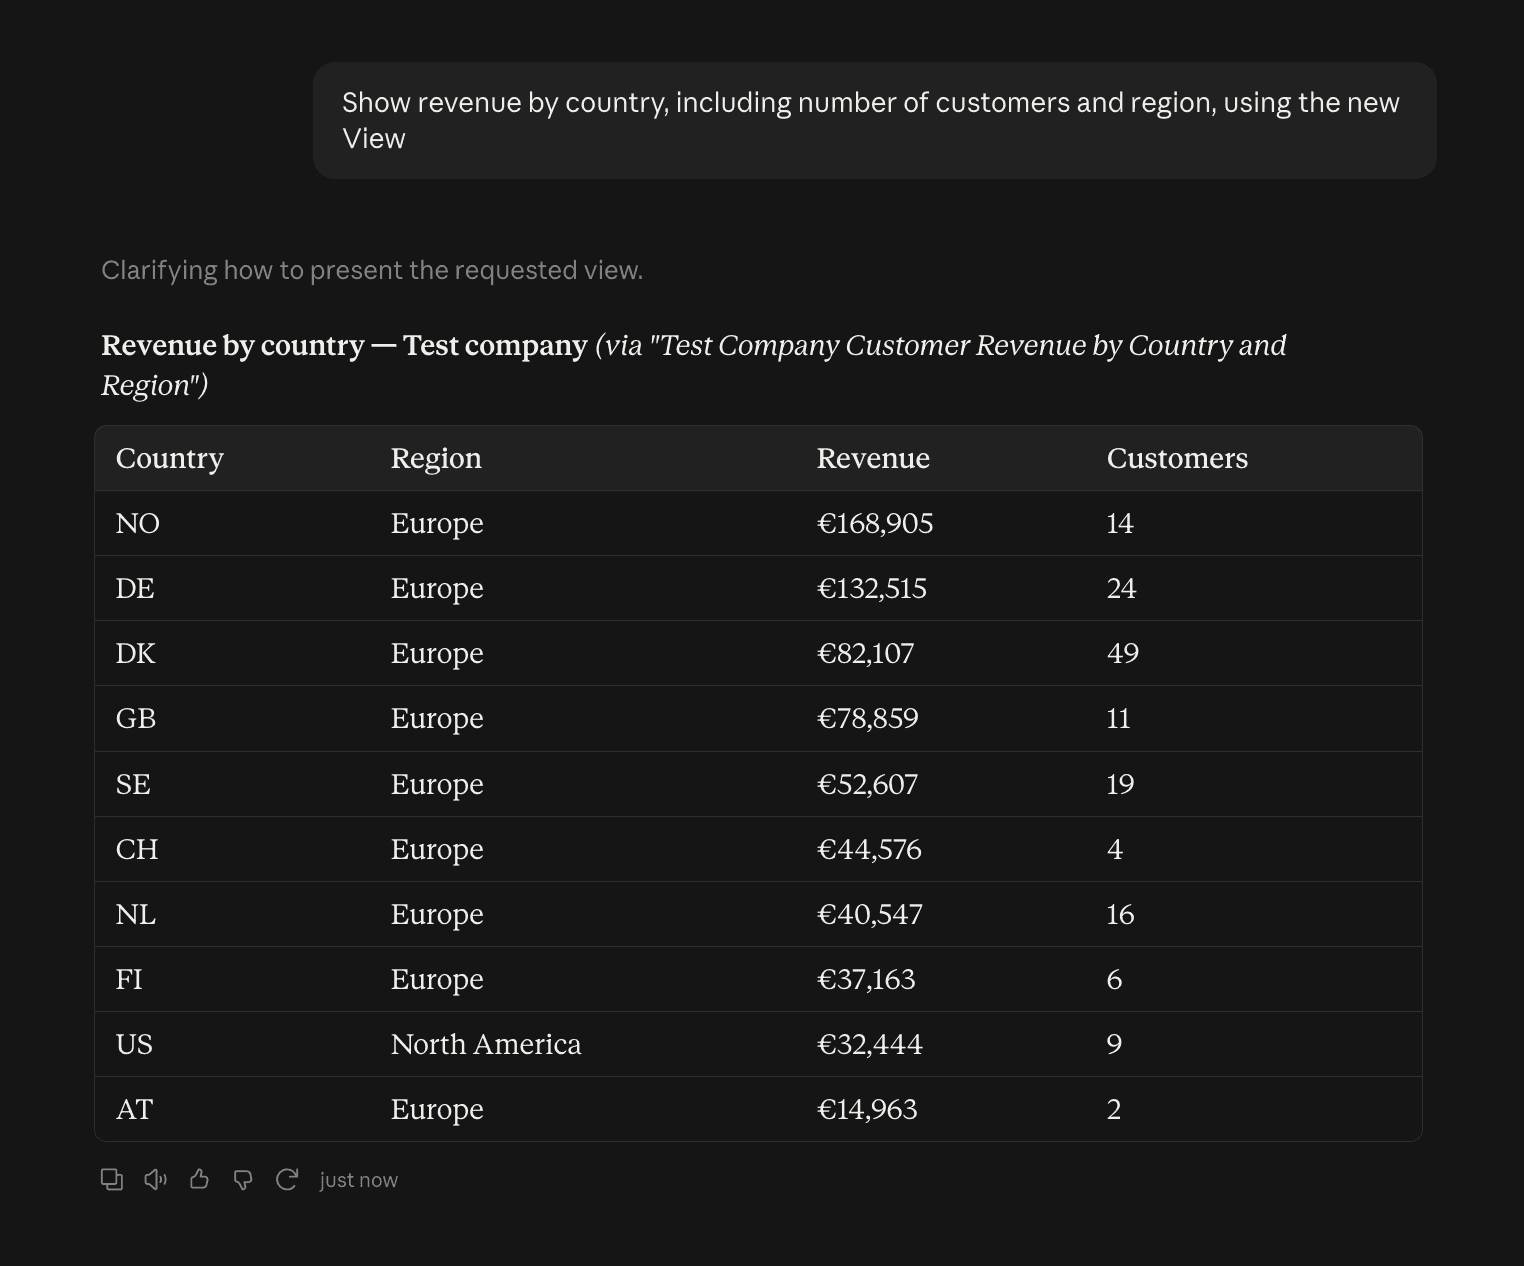
Revenue by country result.
Why this matters
Datasets create a shared and reusable definition of important business concepts such as customers, revenue, products or P&L. Future analyses can be faster, more consistent and easier to verify because they all start from the same documented logic.